What are Bollinger Bands and how do you use them in crypto trading?
What are Bollinger Bands?
Bollinger Bands are a technical analysis indicator used to gain insight into the volatility of a market. The indicator was developed in the 1980s by financial analyst John Bollinger and is now applied across different financial markets, such as stocks, indices, commodities and cryptocurrencies.
Unlike some other indicators, Bollinger Bands are not designed to predict the direction of price movement. They mainly show how far the price deviates from the recent average. This helps investors recognize when a market is relatively calm and when the strength of price movements is increasing. The strength of Bollinger Bands lies primarily in the visual representation of market dynamics, making changes in volatility quickly visible.
Key Takeaways
- Bollinger Bands are a technical indicator that primarily provide insight into the volatility of the crypto market, not the price direction.
- They consist of a moving average with an upper and lower band that move based on standard deviation.
- The width of the bands shows whether the market is calm or experiencing strong price movements.
- Touching the upper or lower band indicates relatively high or low prices, but it is not a standalone buy or sell signal.
- In crypto, Bollinger Bands are especially useful for identifying changes in volatility and trend acceleration, often in combination with other indicators.
What are Bollinger Bands made of?
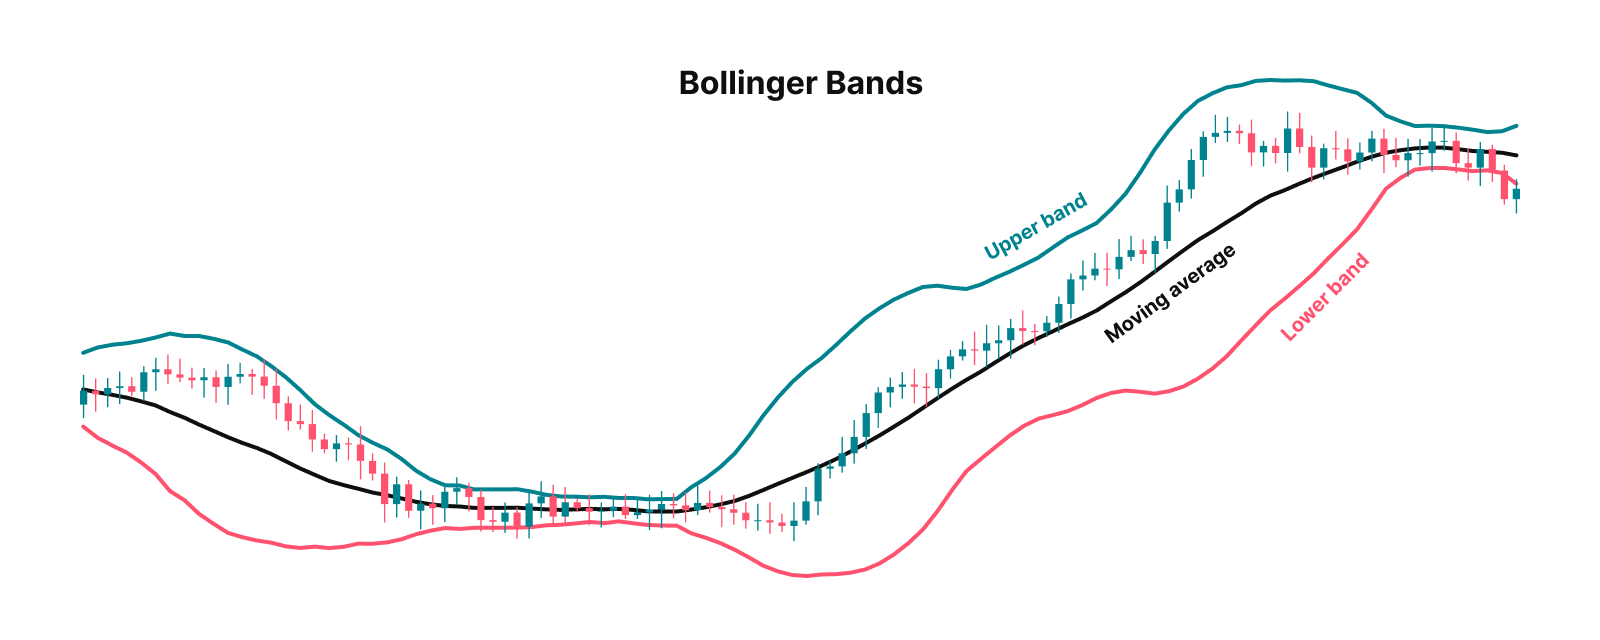
Bollinger Bands consist of three lines that together form a kind of moving price channel. The middle line is a simple moving average, usually calculated based on the closing prices of the past twenty days. This line acts as a reference point for the price.
Above this average is the upper band and below it the lower band. These outer bands are calculated based on volatility and move along with changes in the market. Together, these three lines form a dynamic zone within which the price usually moves. When the market becomes more volatile or calmer, the bands automatically adjust.
How are Bollinger Bands calculated?
The calculation of Bollinger Bands starts with determining a simple moving average, usually over twenty days. Then the standard deviation of the price over the same period is calculated. Standard deviation is a statistical value that indicates how strongly values deviate from the average and is used within Bollinger Bands as a measure of volatility.
The upper band is usually placed two standard deviations above the average and the lower band two standard deviations below it. This setup is widely used because it captures most normal price movements, while extreme outliers remain visible.
Bollinger Bands formula
Bollinger Bands consist of three separate calculations:
- Middle band (SMA) = Simple moving average over n periods (usually 20)
- Upper band = SMA + (k × standard deviation)
- Lower band = SMA − (k × standard deviation)
Where:
n = number of periods (standard 20)
k = number of standard deviations (standard 2)
Example
Suppose the 20 day simple moving average of Bitcoin is €40,000. The standard deviation over that same period is €1,500.
- Middle band: €40,000
- Upper band: €40,000 + (2 × €1,500) = €43,000
- Lower band: €40,000 − (2 × €1,500) = €37,000
In this case, the Bollinger Bands move between €37,000 and €43,000. When the price moves toward the upper band, the price is relatively high compared to the recent average. When the price moves toward the lower band, it is relatively low. The distance between the bands provides direct insight into the current volatility of the market.
What does the width of Bollinger Bands say about volatility?
The distance between the upper and lower band provides direct insight into the strength of volatility. When the bands are far apart, this indicates strong price movements and increased uncertainty in the market. Narrow bands indicate low volatility, where the price moves within a smaller range.
Because Bollinger Bands automatically adjust to changes in standard deviation, they quickly make shifts in market rhythm visible. This helps investors distinguish between calm phases and periods when the market becomes more active.
What does it mean when the price touches the upper Bollinger Band?
When the price approaches or touches the upper Bollinger Band, the price is relatively high compared to the recent average. This is often referred to as an overbought situation.
In calm or sideways markets, this can indicate a temporary exaggeration, after which the price moves back toward the average. In strong upward trends, touching the upper band can actually mean the market is strong and buyers remain dominant. How you interpret this depends heavily on the broader trend and market conditions.
What does it mean when the price touches the lower Bollinger Band?
When the price touches the lower Bollinger Band, this is often seen as a situation where the price is relatively low compared to the average. This is generally referred to as an oversold situation.
In stable markets, this can be accompanied by a temporary correction toward the middle band. In downtrends, however, the price can remain along or below the lower band for an extended period without immediately recovering. This shows that Bollinger Bands do not indicate exact turning points, but mainly help visualize price movements.
What is a Bollinger Band squeeze?
A Bollinger Band squeeze occurs when the distance between the upper and lower band becomes very small. This indicates a period of low volatility where supply and demand appear to be in balance.
So called consolidation phases often precede a larger price movement, because tension builds up in the market. The squeeze itself says nothing about the direction of a potential breakout, but it does signal that a change in volatility is likely approaching. That is why this is a situation that people in technical analysis watch closely.
Why do Bollinger Bands work differently in crypto than in stocks?
The crypto market is known for its higher volatility and often longer trends compared to traditional stock markets. As a result, prices within Bollinger Bands often behave slightly differently.
Where mean reversion interpretations are common in stocks, moments when prices tend to return to the average, crypto prices in strong trends can move along one of the bands for an extended period. This makes Bollinger Bands in crypto especially suitable for identifying changes in volatility and potential trend acceleration, rather than predicting short term turning points. Whether the market is in a bull or bear market plays an even greater role here.
Which indicators are Bollinger Bands often combined with?
Because Bollinger Bands mainly show volatility and do not indicate direction, they are often combined with other technical indicators. Momentum indicators such as the Relative Strength Index (RSI) or the MACD can help assess the strength behind a price movement.
Volume indicators can also be used to provide additional context to price movements. By combining Bollinger Bands with other indicators, you get a clearer picture when interpreting price action.
Which settings are most commonly used in crypto?
Within the crypto market, Bollinger Bands are usually set with a 20 period simple moving average and the bands at two standard deviations. This configuration is often used as a starting point because it provides a good picture for assessing volatility.
At the same time, crypto is generally more volatile than traditional markets and trends can last longer. As a result, standard settings can behave differently, especially on shorter timeframes. Some investors adjust the period or the number of standard deviations to better align with their chosen strategy and market rhythm. This does require experience and it is important to understand how these adjustments affect interpretation. On lower timeframes, such as the 5 or 15 minute chart, Bollinger Bands react faster and may be touched more frequently, while on higher timeframes they move more calmly.
Pros and cons of Bollinger Bands
Advantages
- Clearly and visually show changes in volatility
- Automatically adjust when the market becomes calmer or more volatile
- Widely applicable across different markets and timeframes
- Provide context for price movements relative to the recent average
Disadvantages
- Do not provide information about the direction of a price movement
- Touching a band is not a standalone buy or sell signal
- Can be misleading in strongly trending or extremely volatile markets
- Require context and additional analysis to be interpreted correctly
Who are Bollinger Bands suitable for?
Bollinger Bands are suitable for investors who want to gain insight into volatility and market structure. The indicator is visually accessible and relatively easy to understand, but to use it properly you need nuance and patience.
Especially for those who want to learn how to interpret technical analysis, Bollinger Bands can be a valuable addition, but they should be used within a broader analytical context. Particularly in periods of high volatility, it is important not to treat every contact with a band as an action point, but first determine which market phase the price is in.
Final thoughts
Bollinger Bands are a powerful tool for better understanding the behavior and rhythm of the crypto market, mainly because they make changes in volatility quickly visible. They help investors add context to price movements relative to the recent average, but they should never be used on their own. Especially in the volatile and trend sensitive crypto market, it is important to combine Bollinger Bands with trend, momentum and volume indicators and always consider the broader market phase. Those who apply this nuance can effectively use Bollinger Bands as part of a broader technical analysis.