What is Technical Analysis and How Does It Work?
What is Technical Analysis?
Technical analysis is a strategy used by experienced investors to determine when to buy or sell. It is used in both the stock market and the crypto market. Fundamental analysis looks at things like a company's financial health or the value of a product. In contrast, technical analysis focuses on historical price data of a coin or asset. The goal is not to assess how good a certain asset or coin is, but to predict how its price might develop in the near future.
Key Takeaways
-
Technical analysis focuses on predicting price based on historical data.
-
Instead of fundamental figures, it revolves around charts, patterns, and trends.
-
Using indicators and charts, you can choose better moments to buy or sell.
-
It is mainly a useful method for experienced investors and traders.
-
Commonly used tools include trendlines, support and resistance levels, indicators, and candlestick patterns.
How Does Technical Analysis Work?
In technical analysis, the assumption is that everything you need to know is already reflected in the price. This means you don’t have to read annual reports or look at the quality of the product. You simply believe in historical data. So, you mainly look at charts.
The reasoning behind this is essentially a psychological game: human behavior is predictable, and investors who swear by technical analysis believe this is why it works. It might sound abstract, but technical analysis is actually about quantitative analysis (numbers).
Common tools in technical analysis include:
-
Trendlines: visual lines indicating whether a stock is in an upward or downward trend.
-
Support and Resistance Levels: price points where the price often slows down or breaks through. Also known as support and resistance.
-
Indicators: tools such as RSI (Relative Strength Index), MACD (Moving Average Convergence Divergence), or Bollinger Bands that help identify overbought or oversold conditions.
-
Candlestick Patterns: visual patterns in the chart that often recur at price reversals or trend continuations.
When Do You Use Technical Analysis?
Technical analysis is especially popular among active investors and traders who take positions in the short or medium term. Think of:
-
Day traders who open and close multiple positions in a single day.
-
Swing traders who hold positions for several days or weeks.
-
Long-term investors who use technical signals to find better entry points for the long term.
Although technical analysis doesn’t offer guarantees, it can help increase the likelihood of successful trades. You can assume that large companies investing billions don’t do so lightly. Even such organizations closely examine all possible indicators.
Well-Known Trading Patterns
1. Head and Shoulders
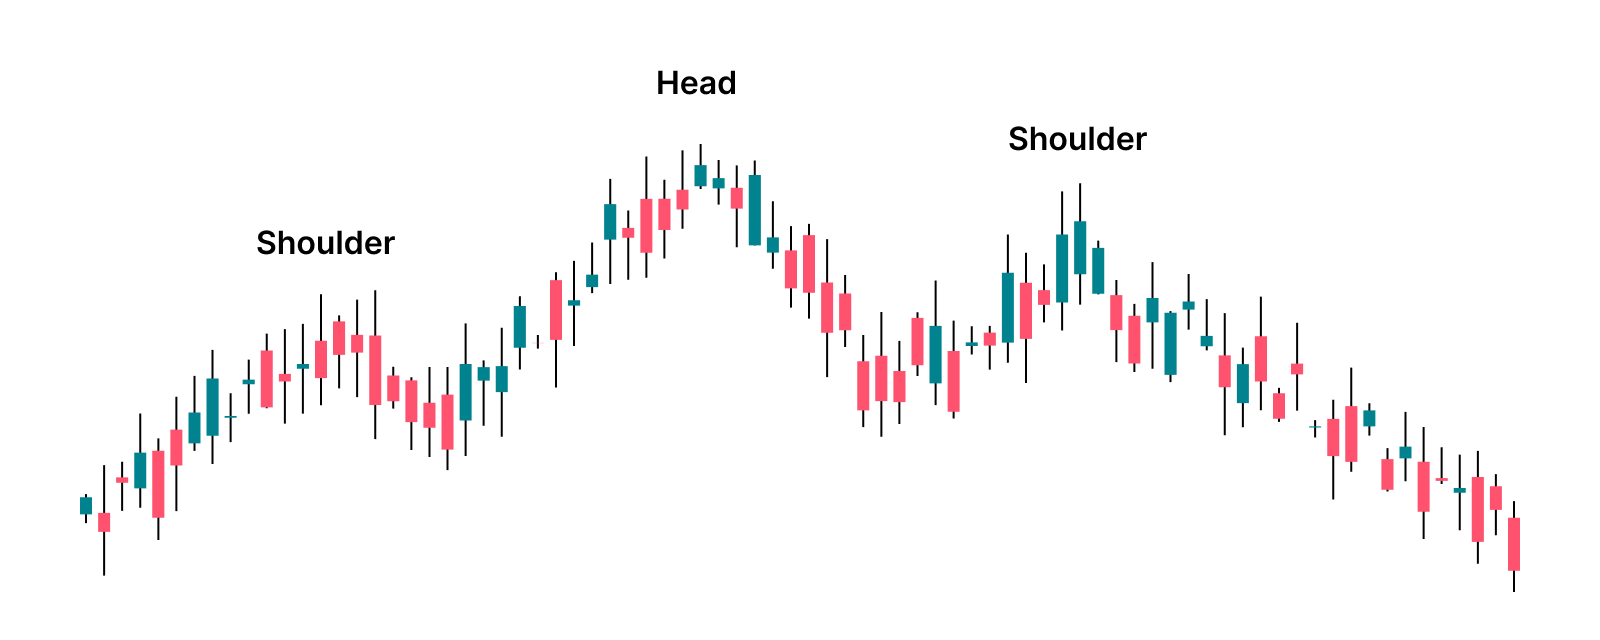
The Head and Shoulders pattern is a specific price pattern that you will often hear about in technical analysis. It indicates that an upward trend is likely to reverse into a decline. In other words: it predicts a trend reversal from bullish to bearish.
How Do You Recognize a Head and Shoulders Pattern?
-
The left shoulder: the price rises to a first peak and then drops a bit.
-
The head: the price rises again, but higher than the first peak. Then the price drops back to the same level as after the first dip.
-
The right shoulder: the price rises once more but only reaches about the same level as the first peak (left shoulder), not as high as the head. Then the price falls again.
You can recognize the pattern by its shape on the chart (it resembles a head with two shoulders).
This pattern is considered one of the most reliable signals that an upward trend is ending. It often signals that it’s time to be cautious about a possible price drop.
2. Double Top
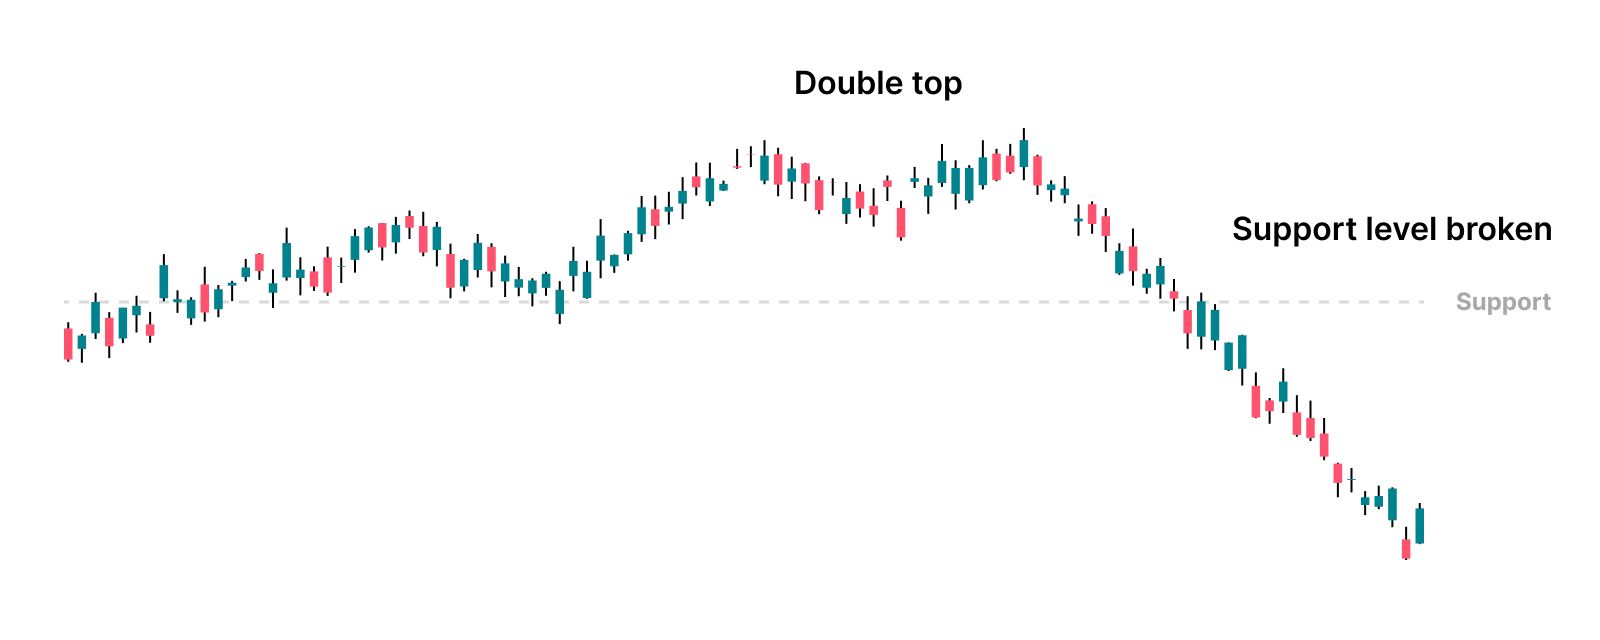
The Double Top pattern is a formation that often indicates that the price of a coin or stock may decline soon. It is a bearish signal, meaning a warning that a particular trend is likely coming to an end.
How Do You Recognize a Double Top Pattern?
-
The price rises to a first peak and then drops slightly.
-
Then the price rises again and reaches about the same level as the first peak.
-
After that, the price drops again and falls below the low between the two peaks.
Only when this final drop occurs (below the so-called support line) is the pattern truly confirmed. The trend is now negative instead of positive.
You can compare it to the shape of the letter M: two tops with a dip in between.
This pattern shows that the market is struggling to break above a certain price. If it fails to do so twice, it's often a sign that sellers are gaining control.
3. Cup and Handle
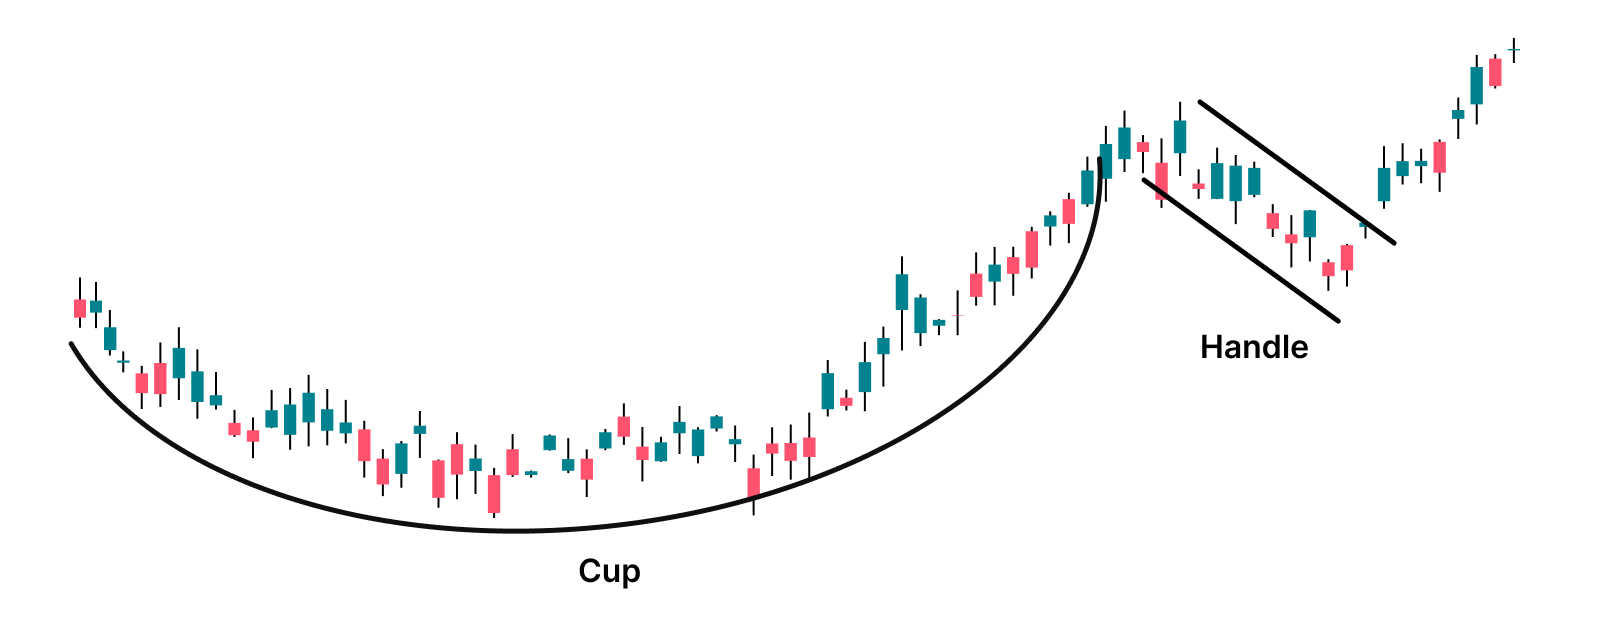
The Cup and Handle pattern is a price formation that looks like a cup with a handle. It is a bullish signal, which means it usually points to a potential price increase. The Cup and Handle is one of the most popular bullish signals in technical analysis.
How Do You Recognize a Cup and Handle?
-
The price makes a rounded, U-shaped drop and rise, this is the cup.
-
Then follows a small drop or sideways movement on the right, this is the handle.
-
During the handle, the trading volume is often lower.
-
Once the price breaks through the top of the pattern, it is often seen as a buy signal.
You can literally see the pattern as a coffee cup with a handle on the right side. It’s a pattern that investors tend to like. The longer the time frame in which this chart forms, the stronger the indicator. The formation of this pattern can take a short time (for example 7 weeks), but sometimes also several months.
The idea behind this pattern is that investors, after a previous rise, hesitate or consolidate, but then become optimistic again and continue buying.
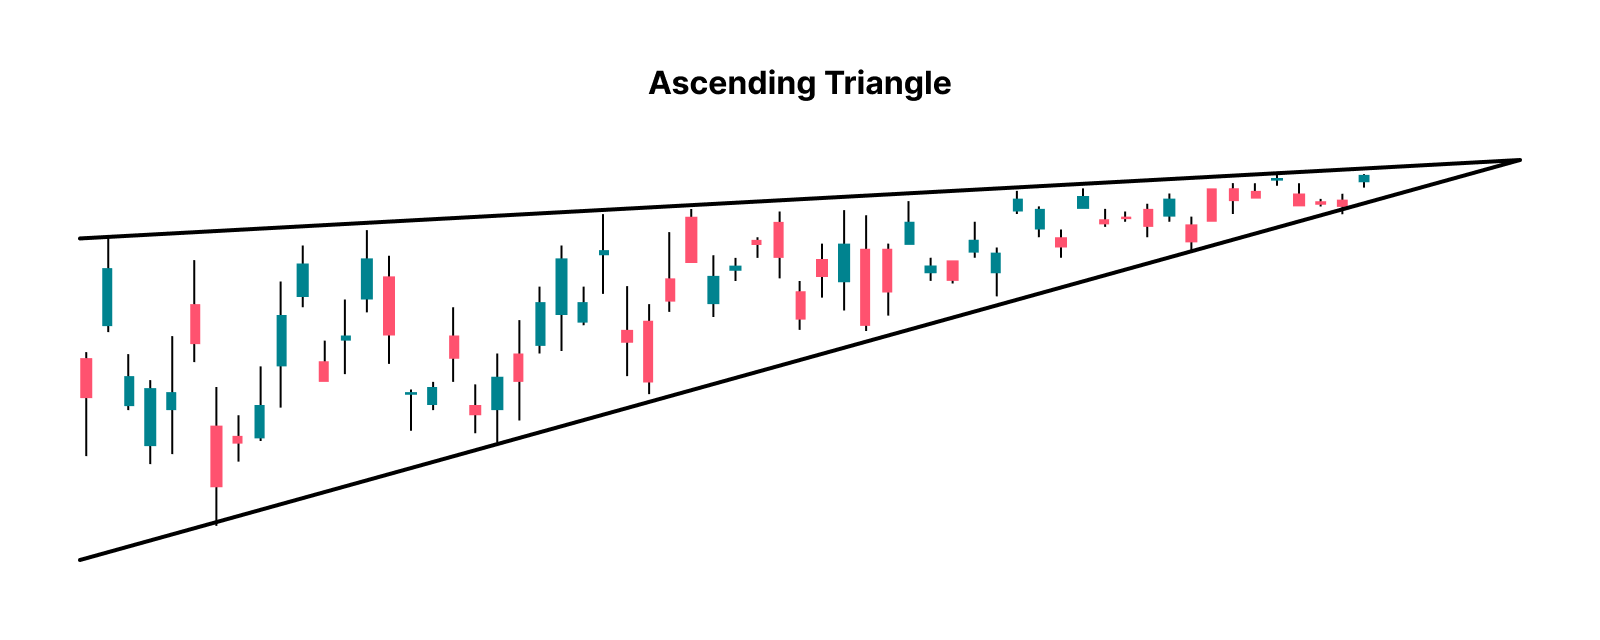
4. Ascending Triangle
There are 3 different types of triangles: the Ascending, Descending, and Symmetrical triangle. The Ascending Triangle pattern is often bullish. In other words: it signals that the price may soon increase.
How Do You Recognize an Ascending Triangle?
-
The top line on the chart is horizontal: the price bounces several times against about the same level.
-
The bottom line slopes upward: the lows get higher and higher, showing that buyers are willing to pay more and more for the coin.
-
Buyers continue to pay more, while sellers keep selling at the same point.
-
Eventually, the price breaks through the horizontal resistance, and the price increases further.
Once the breakout occurs, the old resistance often turns into a new support line. This means that the price may stay at that level during a pullback before rising again. This is what we call the 'support.'
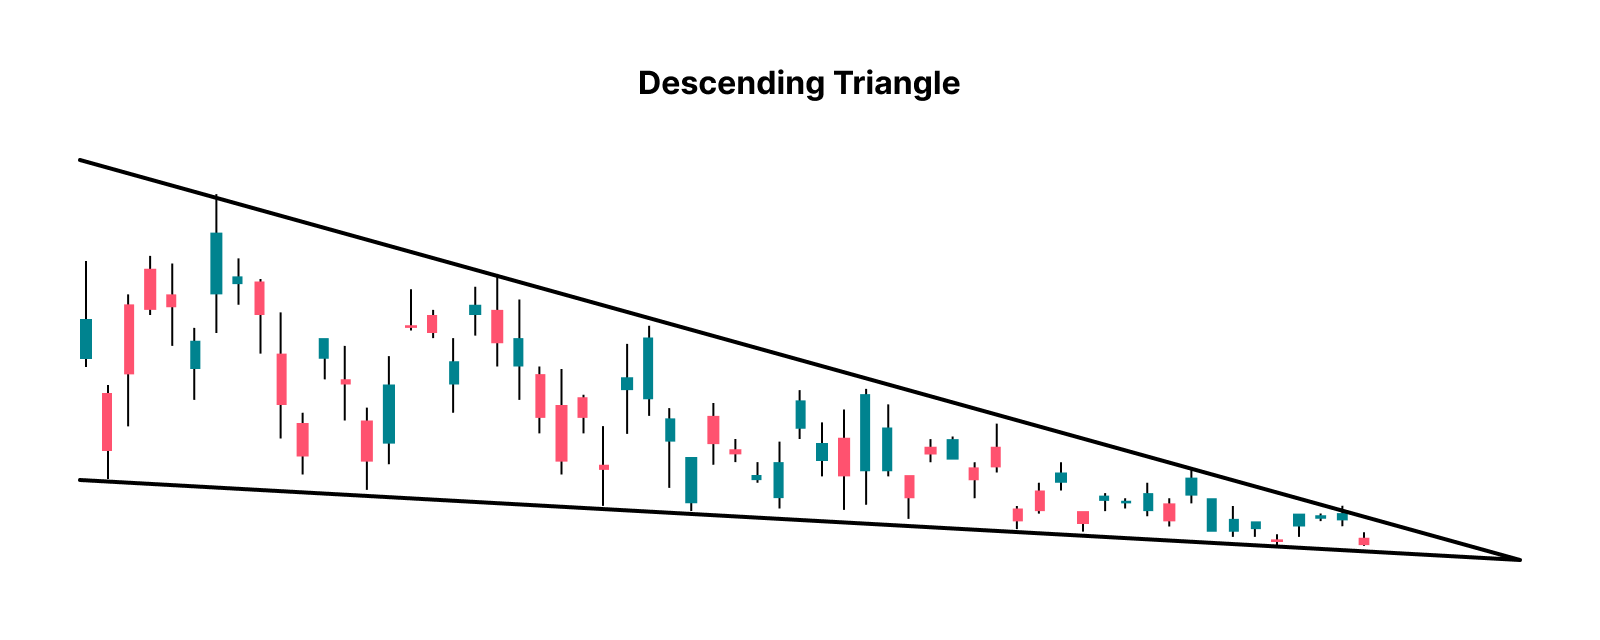
5. Descending Triangle
The Descending Triangle pattern is usually bearish. In other words: there is a higher chance that the price will drop soon.
How Do You Recognize a Descending Triangle?
-
The bottom line on the chart is horizontal: the price bounces several times on the same support level.
-
The top line slopes downward: the highs get lower and lower, showing that sellers are increasingly willing to sell at a lower price.
-
Sellers are becoming more aggressive, while buyers try to maintain the price level.
-
Eventually, the price breaks below the horizontal support line, after which the price often continues to fall.
Once that downward breakout happens, the old support often becomes new resistance. This means that the price will likely struggle to climb back above that level. That’s what we call the resistance.
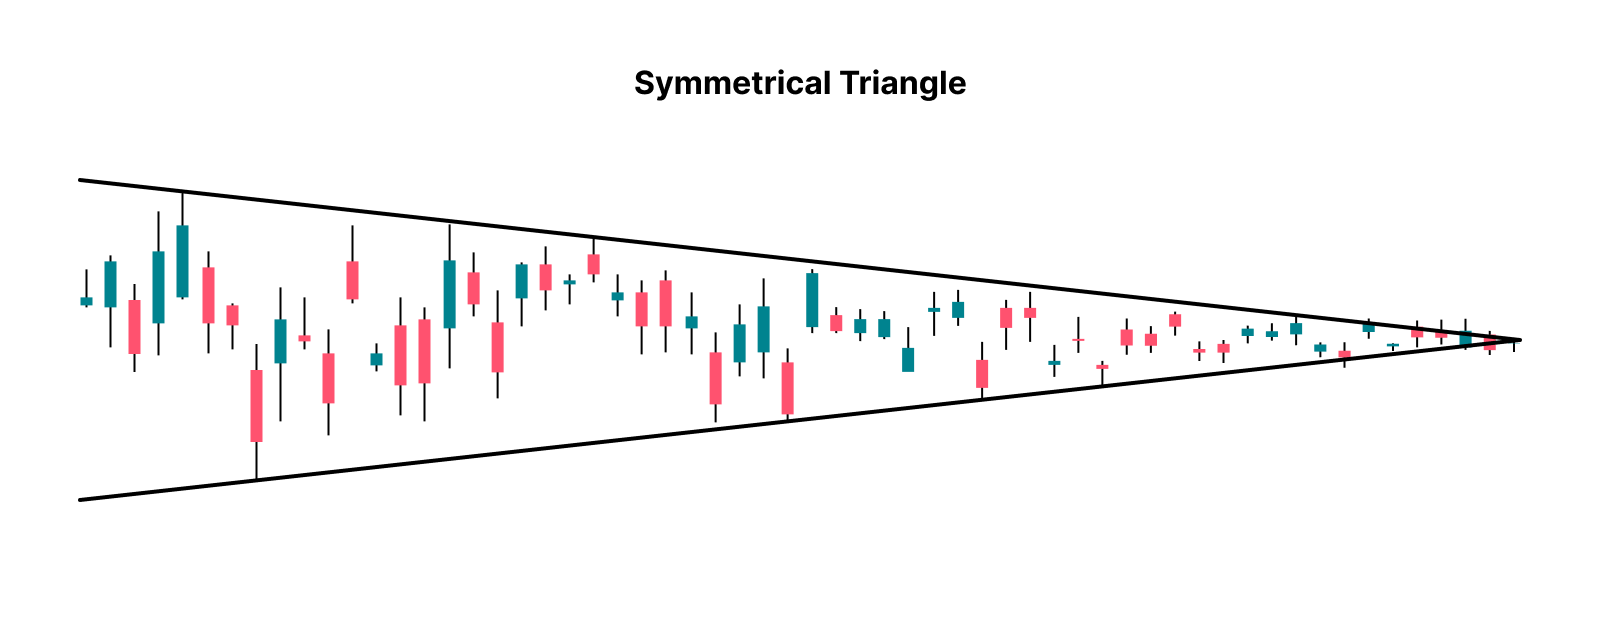
6. Symmetrical Triangle
The Symmetrical Triangle pattern is a neutral pattern. This means it can lead to a breakout either upward or downward (pretty useful information, right). What it actually indicates is that a significant price movement is very likely coming. So be prepared.
How do you recognize a Symmetrical Triangle?
-
The upper line slopes downward: the highs are getting lower.
-
The lower line slopes upward: the lows are getting higher.
-
The price moves closer and closer together in the middle of the point. Something has to happen here.
-
There is less and less room for movement: buyers and sellers often wait here until someone gains the upper hand and then make a decision based on that.
Sooner or later the price will break out, but it can go either way. Note: it is important to watch the volume and direction of the breakout to determine if it is bullish or bearish.
What are technical indicators?
Technical indicators are charts that help you better understand a price chart. These are always based on historical data. Think of price, averages, volumes, and much more. Traders use these indicators to discover trends, determine the right buying or selling moments, and better estimate risks. You can see them as tools that add an extra layer of information to the 'flat' prices you see on a chart.
Popular Technical Indicators
There are dozens of technical indicators investors use to analyze price movements. There are simply too many to discuss extensively, but below we provide an overview of the most well-known indicators. For some, we explain in more detail how they work later on.
Overview of commonly used technical indicators:
-
RSI – Relative Strength Index
-
DMI – Directional Movement Indicator
-
ROC – Rate of Change
-
MACD – Moving Average Convergence Divergence
-
CCI – Commodity Channel Index
-
OBV – On-Balance Volume
-
PVT – Price Volume Trend
-
PVI – Positive Volume Index
-
NVI – Negative Volume Index
-
MFI – Money Flow Index
-
STO – Stochastic Oscillator
-
TRIX – Triple Exponential Average
-
MA – Moving Average
-
MSL – Most Significant Low
-
BB – Bollinger Bands
-
DC – Donchian Channels
-
RS – Relative Strength
As you can see, there is no shortage of indicators. Which ones you use depends on your strategy, experience, and preference.
Why do traders use technical indicators?
Because technical indicators help you to:
-
Identify trends: Is the market going up, down, or sideways?
-
Measure momentum: How strong is the current trend and how much volume is in the asset?
-
Find entry and exit points: When to buy or sell the crypto or asset?
-
Signal overbought or oversold conditions: Is the market overheated or undervalued?
They are mainly used by day traders and swing traders, but long-term investors also sometimes use them to improve their timing.
The 5 most used technical indicators
Let's now dive deeper into the most popular technical indicators.
1. Relative Strength Index (RSI)
The RSI measures how strong recent price movements are. It is a momentum indicator that moves between 0 and 100.
Characteristics of RSI:
-
RSI above 70 = possibly overbought (too much buying)
-
RSI below 30 = possibly oversold (too much selling)
Example: Suppose the RSI of Bitcoin is at 82. That could mean BTC is 'overbought' and a correction is coming. This is one of the most well-known and commonly looked-at indicators.
The advantage is that sometimes people can predict that a coin will get a correction; the disadvantage is that it can give false signals and is therefore not always accurate.
2. Moving Averages (SMA & EMA)
A moving average shows the average closing prices (the price at the end of the day) over a certain period and is displayed as a line on the chart.
Characteristics of SMA & EMA:
-
SMA (Simple Moving Average) is just the average over X number of days.
-
EMA (Exponential Moving Average) gives more weight to recent prices, so the short term is more important here.
Traders, for example, look at the crossing of the 50-day and 200-day EMA:
-
If the short-term moving average crosses above the long-term moving average, this is called a Golden Cross (bullish signal).
-
The opposite is called a Death Cross (bearish signal). The 200-day EMA is especially seen as important here.
The advantage is that it is simple and easy to read. The disadvantage is that it always lags. You do not immediately see the impact.
3. MACD (Moving Average Convergence Divergence)
MACD stands for Moving Average Convergence Divergence. Sounds complicated, but it is just a technical indicator that helps you see if a trend is strengthening or weakening.
Characteristics of MACD:
-
Consists of three parts: MACD line, signal line, and histogram
-
When the MACD line crosses above the signal line → bullish signal
-
When the MACD line crosses below the signal line → bearish signal
The advantage is that it recognizes trend changes well; the disadvantage is that it works less well in a sideways trend.
4. Bollinger Bands
Bollinger Bands are a popular tool among investors to see if a coin or stock might be too expensive (overvalued) or too cheap (undervalued).
They were invented in the 1980s by John Bollinger and consist of three lines on the chart.
Characteristics of Bollinger Bands:
-
a middle line (usually a moving average),
-
and two lines above and below that move with the price.
If the price is close to the upper band, it may mean something is expensive. Is it near the lower band? Then it could be cheap. You can also estimate volatility with them: the further apart the bands, the greater the price fluctuations.
5. Volume
Volume is not a line or chart itself but an essential indicator. It shows how much is traded in a certain period. Suppose the volume of Bitcoin today is 1 billion euros; that means 1 billion euros worth of Bitcoin was traded today. High volume usually indicates high liquidity: it is then easier to buy or sell quickly without the price moving strongly.
Characteristics of volume:
-
Rising price with high volume = strong signal
-
Rising price with low volume = weak signal
Volume is often combined with other indicators to confirm signals.
Important: Use multiple indicators together!
As you may have noticed, there are dozens of indicators you can look at. One thing is certain, history often repeats itself, but not always! So do not invest blindly just because you found a positive indicator. The best approach is to combine multiple technical indicators so you can confirm signals. For example:
RSI indicates a coin is overbought, and at the same time the MACD shows a bearish crossover, plus we see declining volume. These 3 indicators together might tell you that there is a stronger sell signal currently.
Which technical indicator is the best?
That depends on your strategy. RSI is popular for the short term, while moving averages are suitable for following market trends.
Are technical indicators also useful for long-term investors?
Yes, especially to find good entry points or confirm trends.
Can I use technical indicators without experience?
Yes, but start with the basics and test them first on a demo account or with small amounts.
Final thoughts
Technical analysis is a tool for investors to make better decisions about buying or selling an asset like a stock or cryptocurrency based on historical price data. Instead of looking at fundamental factors, technical analysis focuses on charts, patterns, and indicators that predict trends and market behavior.
By recognizing patterns such as Head and Shoulders, Double Top, or Ascending Triangle (and many others), investors try to predict the price. Additionally, they use technical indicators like RSI, MACD, Moving Averages, and Bollinger Bands to get signals about the trend of that crypto coin or asset.
Technical analysis is especially useful for active investors and traders looking for better timing. However, it offers no guarantees and works best in combination with multiple indicators and good risk management. Ultimately, it is about recognizing patterns in human behavior, as well as other factors such as laws and regulations, certain hype, bull markets, and bear markets.