What Is the Relative Strength Index (RSI)?
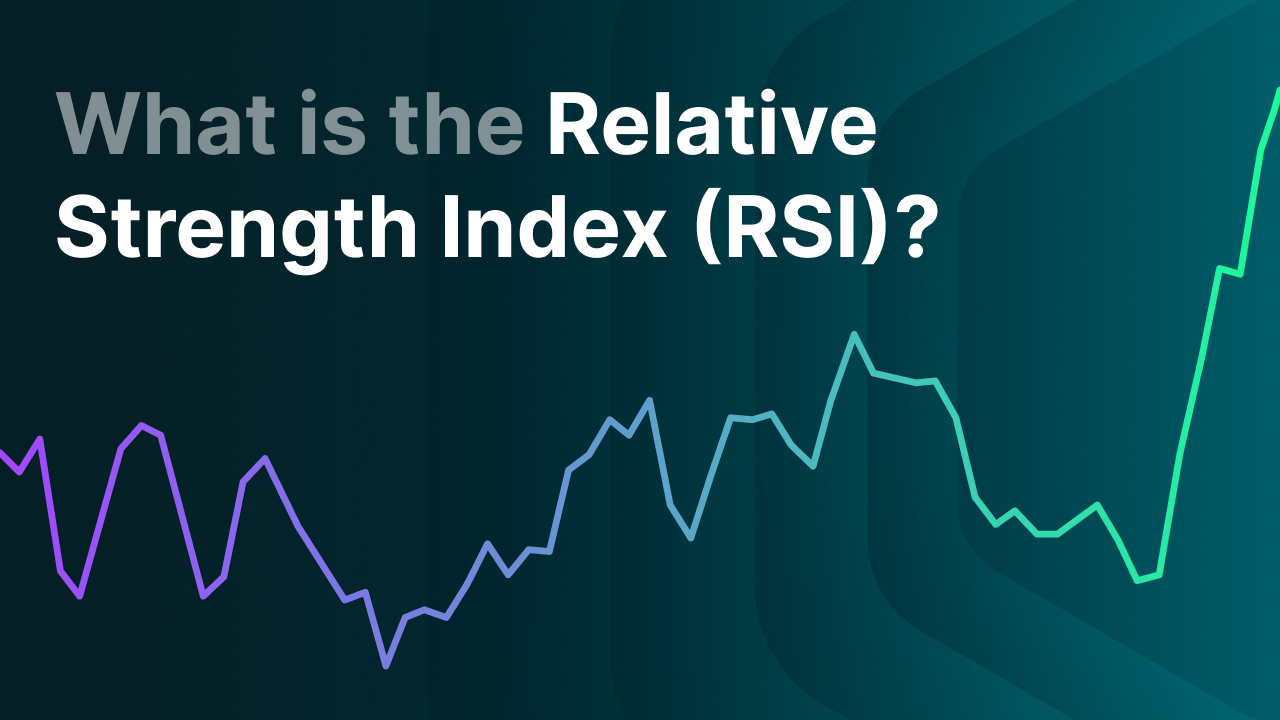
What Is the Relative Strength Index (RSI)?
The RSI (Relative Strength Index) is a technical analysis indicator used to determine whether a cryptocurrency (or stock) is overbought or oversold. The RSI helps investors and traders assess potential trend reversals and good entry points. Investors use the RSI within technical analysis to gain insight into price momentum and to evaluate whether a financial instrument may be overbought or oversold.
The Relative Strength Index was developed in 1978 by American engineer J. Welles Wilder and has since become one of the most well-known and widely used technical indicators.
Key Takeaways
- The Relative Strength Index (RSI) is a technical indicator that measures price momentum and helps identify overbought and oversold situations.
- The RSI moves between 0 and 100 and is usually calculated over a 14-day period.
- Values above 70 can indicate overbought conditions, while values below 30 may point to oversold conditions, especially in sideways markets.
- In strongly trending markets, the RSI can show extreme values for extended periods, which can lead to false signals.
- The RSI is most effective when used in combination with other forms of technical analysis.
How Does the RSI Work?
The Relative Strength Index is a so-called oscillator. This means the indicator moves within a fixed range, specifically between 0 and 100. The RSI compares the average price gains to the average price losses over a predefined period, usually fourteen days.
When the price rises more often or more strongly than it falls during that period, the RSI will be above 50. If losses dominate, the RSI drops below 50. RSI values above 70 are generally considered overbought, while values below 30 are interpreted as oversold. The RSI is usually displayed as a separate chart below the price chart, allowing momentum to be analyzed independently from price action.
What Do Overbought and Oversold Mean in RSI?
The RSI can be used to identify overbought and oversold situations. These are moments when a financial instrument has been heavily bought or sold within a short period.
- An RSI above 70 is often seen as overbought. This means the price has risen sharply and upward momentum may be starting to fade. In such a situation, a correction or temporary pullback may follow.
- An RSI below 30 is usually interpreted as oversold. The price has dropped significantly, which can indicate panic selling or excessive pessimism. This can lead to a recovery move.
These levels are also known as trigger lines. When the RSI breaks through these boundaries, it does not guarantee a price reversal, but it can signal to investors that a particular coin is oversold or overbought and that it may be wise to consider entering or exiting a position.
Example:
Suppose the RSI of Bitcoin rises to 75 on the daily chart. This means the price has increased sharply in a short period and is in the overbought zone. This is not an immediate reason to sell, but it can be a signal to become more alert. In this situation, investors often look for signs that momentum is weakening or for other signals, such as resistance levels or a declining RSI, that may point to a possible correction.
On the other hand, when the RSI drops below 30, it can indicate that the price has fallen too far. In some cases, this is followed by a recovery, especially when selling pressure decreases and the RSI starts to rise again.
How Do You Use the RSI in Different Market Conditions?
The standard levels of 30 and 70 work best in sideways markets. These are markets where the price moves within a certain range for an extended period. Under these conditions, the RSI can provide clear signals for potential corrections or recovery moves.
In strongly rising or falling markets, the RSI behaves differently. In a bull market, the RSI can remain above 70 for a long time without the price dropping immediately. In a bear market, the RSI can stay below 30 for extended periods while the price continues to fall. This does not mean you should immediately buy when a coin is oversold or sell right away when it is overbought. Always use the RSI in combination with other indicators and make your own assessment.
To account for this, some investors adjust the RSI levels. In a bull market, for example, levels of 40 and 90 may be used, while in a bear market, levels of 20 and 60 are more common. This helps the RSI better align with the prevailing trend.
Which RSI Period Should You Use?
The default RSI setting is a fourteen-day period, but this is not a fixed rule. Shorter periods, such as five to nine days, make the RSI more sensitive. This results in more signals, but also more noise.
Longer periods, such as 21 or 30 days, create a smoother RSI with fewer fluctuations and fewer signals. These are often used by investors with a longer time horizon. The most suitable period depends on the volatility of the market, the desired sensitivity, and the chosen strategy.
How Is the RSI Calculated?
The RSI is calculated based on closing prices. Over the selected period, the average price gains and the average price losses are analyzed. Using this data, the following formula is applied:
RSI = 100 − (100 / (1 + RS))
Where RS stands for the average gain divided by the average loss.
The result is always a value between 0 and 100 and reflects the momentum of the price.
What Does a Divergence Between Price and RSI Mean?
In addition to fixed levels, investors also look for divergences between the price and the RSI (this means the price and the indicator are not moving in the same direction).
With a positive divergence, the price makes a lower low while the RSI forms a higher low (the price is still falling, but negative momentum is decreasing). This can indicate weakening downward pressure and a potential trend reversal.
With a negative divergence, the price makes higher highs while the RSI shows lower highs (the price is still rising, but upward momentum is weakening). This can point to weakening bullish momentum.
Divergences can provide valuable signals, but they are less reliable in strong bull or bear markets. That is why they are often combined with other forms of analysis.
The Importance of the 50 Level
The 50 level of the RSI is often used as a neutral dividing line.
- Above 50, positive momentum usually dominates.
- Below 50, downward momentum is stronger.
A break above or below this level can be seen as confirmation of a change in strength. This method is often used in trend-following strategies.
RSI Patterns: Failure Swings and Swing Rejections
Some investors focus on specific patterns in the RSI chart. A well-known example is the failure swing. In this case, the RSI forms a W pattern during potential upward moves or an M pattern during potential downward moves, without necessarily breaking the 30 or 70 level.
Another method is the swing rejection. Here, the RSI first enters the overbought or oversold zone and then moves back. After that, the RSI attempts to return to that zone but fails to do so. The RSI then continues moving in the opposite direction.
How Do You Use the Relative Strength Index (RSI)?
The RSI is usually not used on its own. Many investors combine the indicator with other forms of technical analysis, such as moving averages, support and resistance levels, or indicators like the MACD. By combining multiple indicators, a more complete and better-supported view of the market emerges.
Limitations of the RSI
Like other technical indicators, the RSI has its limitations. For example, the indicator does not take trading volume into account and can show extreme values for extended periods during strong trends. In addition, the RSI is based on historical data and does not guarantee future price movements.
Common Mistakes When Using the RSI
A common mistake is drawing conclusions too quickly. Investors sometimes react immediately to a high or low RSI value without waiting for confirmation. An RSI above 70 or below 30 is mainly a warning, not a direct buy or sell signal.
The RSI is also sometimes used across multiple timeframes at the same time, which can lead to conflicting signals. That is why it is important to determine in advance which timeframe and settings will be used.
The RSI is also often applied without considering the overall trend. In strong upward or downward markets, the RSI can show extreme values for long periods. Those who trade blindly based on this risk entering against the trend too early.
Finally, it is important to realize that no indicator is perfect. The RSI is a tool, not a guarantee. By using the RSI as support within a broader analysis, this indicator can be applied more effectively and thoughtfully.
Final Thoughts
The Relative Strength Index is an accessible and widely used indicator that can provide valuable insights into momentum and potential price turning points. By always interpreting the RSI within the broader market context and combining it with other analytical methods, investors can make better-informed decisions and reduce the risk of misleading signals.