What is a moving average and how does it help you identify trends?
What is a moving average?
A moving average (MA) is an indicator from technical analysis that helps you identify price movements and the underlying trend. It helps traders in cryptocurrencies or traditional markets such as stocks gain better insight into an asset. With a moving average, instead of focusing on all short-term spikes and dips, you look at the average closing prices over a selected period.
With a moving average, you can often see more quickly whether the market over that period is mainly moving up, down, or sideways. This indicator therefore fits well with the well-known idea many trend followers use: it is better to move with an existing trend than to constantly react to small fluctuations.
It is important to understand that moving averages are lagging. They are calculated based on past prices and therefore always lag slightly behind current price action. This is not a flaw or a problem, but a characteristic that actually makes the line more stable.
Key Takeaways
- A moving average (MA) is a rolling average that filters out noise and makes trends visible.
- SMA weights all prices equally. EMA reacts faster because recent prices count more heavily. WMA applies a linear heavier weight to recent prices.
- The selected period determines how quickly the moving average reacts: shorter equals faster but more noise, longer equals slower but more stable.
- Crossovers (such as Golden or Death Cross) can signal trend changes, but often come with a delay.
- Use MAs mainly as trend context and combine them with other signals and risk management.
Why do investors and traders use moving averages?
Moving averages are often used by traders for three purposes:
1. Identifying and following trends
A rising moving average line usually indicates an upward trend over the selected period, while a falling line indicates a downward trend. With a moving average, you gain insight into the direction of the trend without focusing solely on the most recent price movements.
2. Approaching support and resistance dynamically
In trending markets, traders can use a moving average as a kind of moving reference level. Some traders pay attention to whether the price bounces around the MA or breaks through it, which can indicate support or resistance.
3. Structuring signals (with rules instead of intuition)
Many traders also use strategies where moving averages serve as objective conditions. For example, they only become bullish when the price is above the moving average or only trade in the direction of the longer-term MA trend. The 200-day moving average for Bitcoin is often used as a guideline by investors.
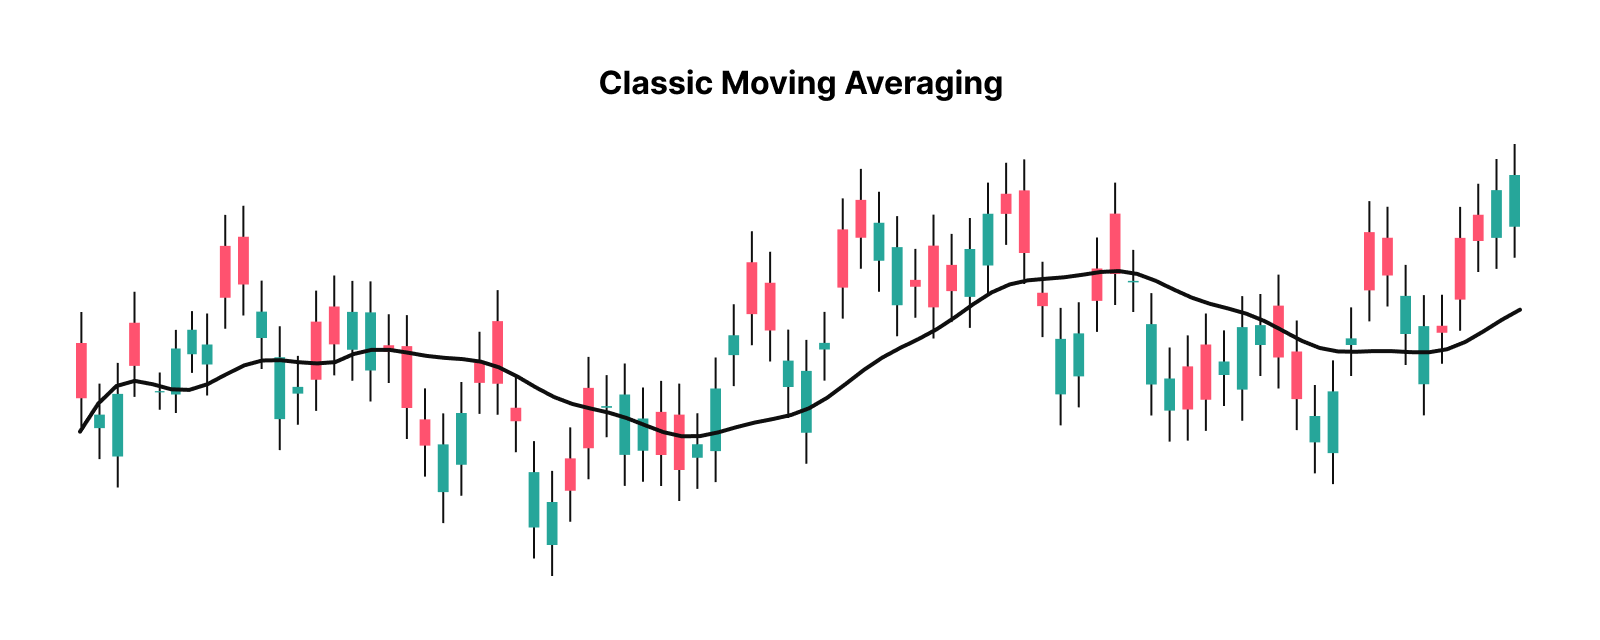
How does a moving average work exactly?
A moving average literally works as a rolling average. The "moving" aspect lies in the sliding window. Suppose you choose a moving average with a period of 10 days, then you calculate the average of the last 10 closing prices. The next day, you repeat this calculation, but now including the newest closing price and removing the oldest one. In other words: the longer the timeframe, the more reliable the moving average, which is why the 200-day MA is so important.
You can apply a moving average to different time units: days, hours, or minutes. The shorter the period, the faster the moving average reacts, but usually the more noise it captures. In addition, there are different types of moving averages you can use.
Most important types of moving averages
Simple Moving Average (SMA)
The Simple Moving Average (SMA) is the most basic variant. All prices in the window are weighted equally, summed, and divided by the number of periods.
Simple example: if the Bitcoin closing prices of the past days are 90,000, 100,000, and 110,000, then the 3-period SMA is: (90,000 + 100,000 + 110,000) / 3 = 100,000. This example clearly shows how the SMA smooths out extreme price movements into a more fluid line.
Exponential Moving Average (EMA)
The Exponential Moving Average (EMA) is similar to the Simple Moving Average (SMA), but places more emphasis on recent prices. As a result, the EMA reacts faster to changes than an SMA over the same period. That is why investors often choose an SMA when they want a calmer long-term view, while traders more often use an EMA when they want to respond more quickly to trend or momentum changes.
Weighted Moving Average (WMA)
In addition to the Simple Moving Average and Exponential Moving Average, there is also the Weighted Moving Average. With a WMA, recent closing prices receive a linearly higher weight. This means that each closing price closer to the present becomes incrementally more important.
Which period should you choose for a moving average?
An important factor of a moving average is the period you choose, as this determines how sensitive the indicator is.
- Shorter periods (for example 10-20): faster, more signals, but also a higher chance of false signals in choppy markets.
- Longer periods (for example 50-200): slower, less noise, better for the bigger picture.
This is why the 50 and 200 moving averages are commonly used, as they are long-term references that many traders follow and consider important in chart analysis. This does not necessarily mean they are more profitable, but rather that many traders pay close attention to them.
How traders use moving averages in practice
If you want to start using moving averages, there are several ways to do so. Below are the most common approaches.
1. Price versus moving average
The most common interpretation is:
- Price above the moving average > trend is more likely bullish
- Price below the moving average > trend is more likely bearish
You should mainly see this as context and not as an automatic buy or sell button. In a sideways market, the price can continuously move above and below the MA without a clear trend developing.
Some strategies also use the crossing of price and MA as a trigger, for example buying on an upward cross and selling on a downward cross. This generally works better in clearly trending markets than in sideways phases.
2. Crossovers: lines crossing each other
Another commonly used application is comparing two moving averages: a shorter (faster) one and a longer (slower) one. The idea is that this not only shows the trend, but also whether momentum is shifting.
- Bullish crossover: the short MA crosses from below to above the long MA. This is often seen as confirmation that upward momentum is strengthening.
- Bearish crossover: the short MA crosses from above to below the long MA. This is often seen as confirmation that downward momentum is taking control.
More well-known names for these are:
- Golden Cross: often the 50-day (short) crosses above the 200-day (long), bullish
- Death Cross: often the 50-day (short) crosses below the 200-day (long), bearish
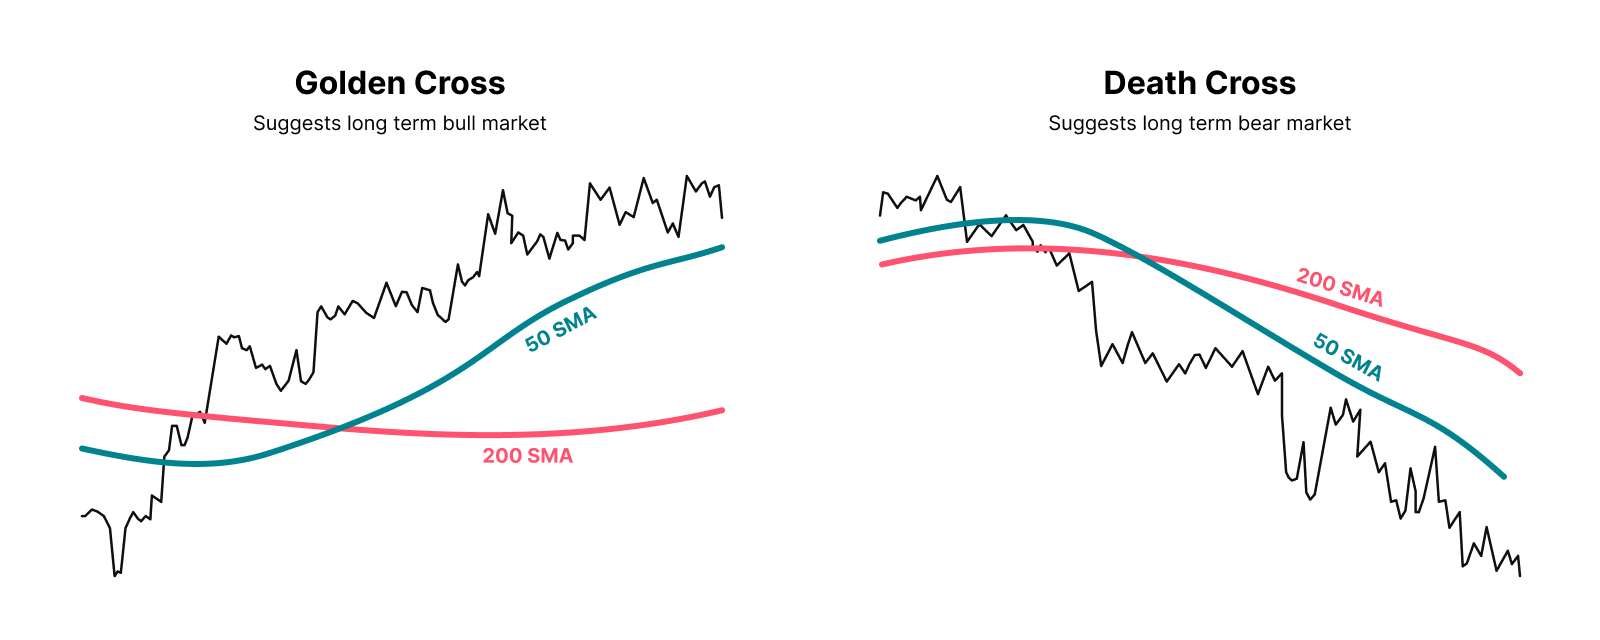
Be aware that crossovers are lagging, meaning they are based on historical prices. As a result, a crossover often occurs after part of the move has already taken place. If the price rises quickly, the MA will lag because older prices are still included. This delay is called lag. The longer the periods, such as 50 and 200, the greater this lag becomes.
3. MACD: an indicator built on moving averages
The Moving Average Convergence Divergence (MACD) is a momentum and trend indicator that shows how two exponential moving averages (EMAs) relate to each other. In the standard setup, you first calculate the MACD line by subtracting the 26 EMA from the 12 EMA. A signal line is then plotted on top, usually a 9-period EMA of the MACD line. The difference between the MACD line and the signal line is often displayed as a histogram, allowing you to quickly see whether momentum is increasing or decreasing.
Many traders focus on (1) crossovers between the MACD line and the signal line as potential buy or sell signals, and (2) the zero line. Above zero often indicates bullish momentum, while below zero indicates bearish momentum. As with moving averages, MACD is based on historical data and therefore works best as confirmation within a broader analysis, not as a standalone trading system.
4. Moving average ribbon (multiple MAs at once)
A ribbon is a set of moving averages on one chart, for example 20, 50, 100, and 200. The advantage is that you can more quickly see whether the market is broadly trading above its averages and whether those averages are all pointing in the same direction. The downside of an MA ribbon is that more lines also mean more crossovers, which can quickly create a cluttered view, especially when the market is not clearly trending.
Advantages of moving averages
- Simple and visual: you can see at a glance whether the trend over a certain period is moving up, down, or sideways.
- Filters out noise: by working with averages, short-term spikes become less dominant in your analysis.
- Helps with trend context: many traders use MAs to determine whether they want to think mainly long or short.
- Can highlight support and resistance: in trending markets, a moving average can act as a dynamic reference level.
Disadvantages of moving averages
- Always lagging: the MA only reacts after the price has already moved. The longer the period, the greater this effect.
- Sideways markets are challenging: when price fluctuates without a clear direction, MA signals can quickly alternate.
- Should not be used in isolation: never use a moving average indicator as your only analysis. MAs work best in combination with other analyses, such as price action, volume, or momentum indicators like RSI or MACD, as well as proper risk management.
It is best to use a moving average to determine trend context first, and only then look for entries and exits with additional confirmation. This helps prevent entering or exiting on every minor crossover.
Final thoughts
A moving average is an accessible indicator for smoothing price action and making trends more visible, but it remains a lagging indicator that often provides signals only after part of the move has already occurred. Crossovers, price crossings, and a moving average ribbon can help identify or confirm trend changes, while in sideways markets you are more likely to encounter false signals. Therefore, use moving averages mainly as trend context, choose a period that fits your time horizon, and combine MAs with other signals such as price action, volume, or momentum, along with clear risk management, so that you use them as an analysis tool rather than a standalone trading system.