Mira Price MIRA

Mira MIRA
0,040807 -5,71%
EUR
MIRA
Trade MIRA
Stay up to date with the latest Mira price, market trends, and real-time data. Track MIRA price performance, analyze historical charts, and trade with ultra-low trading fees: 0,15% per trade.
€ 0,040807 -5,71% Today

Winner Best Crypto Platform

IEX Golden Bull 2025

  • 120K+

    Registered users

  • €6B

    Trading volume

  • €1B

    Deposits & withdrawals

  • 11M

    Executed trades

Mira Price Today

The current Mira price is €0,040807 with a 24-hour trading volume of €3.039.615,82. This is a decrease of -5,71% in the last 24 hours. We update our MIRA to EUR price in real-time. The current market cap of Mira is €14.630.370,01. It has a circulating supply of 358.247.124,81 MIRA coins.


Mira Market Data

Current price
€ 0,040807
Market cap
€ 14.630.370,01
Volume (24H)
€ 3.039.615,82
Circulating supply
358.247.124,81 MIRA
Trading activity
0% Buy 0% Sell
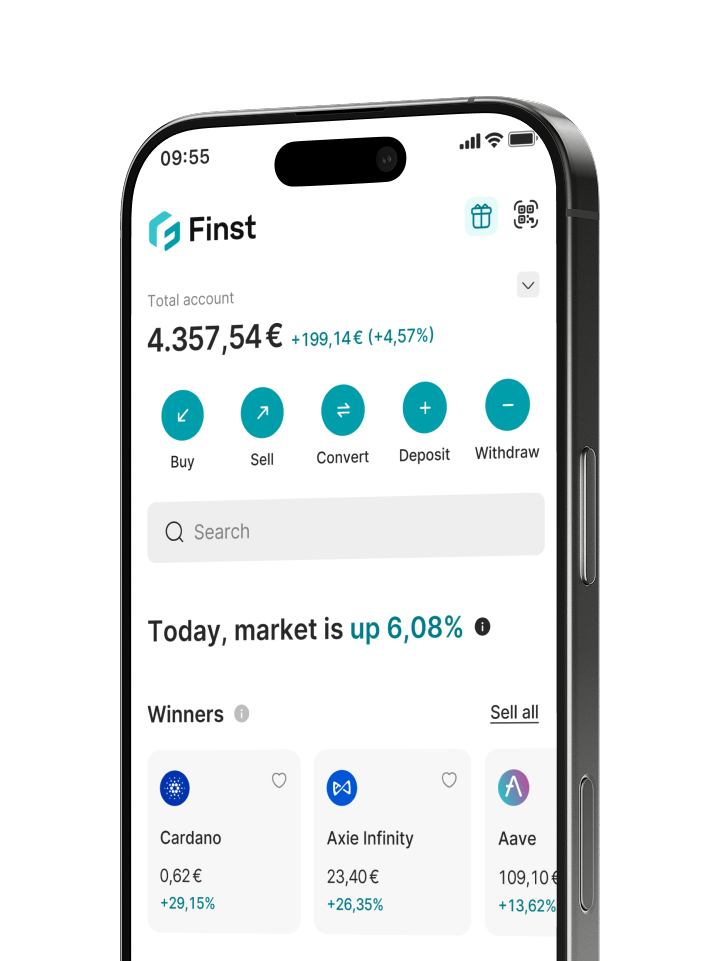
Preview MIRA on the Finst platform

Mira (MIRA) Price Performance

1 week
+9,03%
1 month
-5,35%
1 year
-84,45%
Year-to-date
-66,76%
All-time change
-83,95%

Mira Price Highs & Lows

All-time low
€ 0,031837
All-time high
€ 0,3126
1W € 0,0366
€ 0,044554
1M € 0,0366
€ 0,051703
1Y € 0,031837
€ 0,3126
YTD € 0,031837
€ 0,164

Mira information


Mira Price History


  • 2025 - Price range: €0,09558 - €0,3126
    Mira ’s price rose above €0,30 in October, then dropped quickly. In November and December, the price kept falling and reached €0,09558 around mid-December. After that, it recovered by 31.5% to €0,1257 at the end of the year. Mira launched its mainnet in September, which moved the network out of the test phase and opened up features for registration, verification, and staking.
  • Q1 2026 - Price range: €0,06244 - €0,164
    Mira started the quarter around €0,126 and briefly climbed to €0,164 in January. After that, the price fell steadily, with a short bounce at the end of February, and reached €0,06244 at the end of March. The price ended the quarter at €0,06654, 47.1% lower than at the start. This drop came alongside selling pressure in the crypto market and a broader shift away from growth stocks.
  • Q2 2026 - Price range: €0,0342635 - €0,0974035
    Mira started the quarter around €0,0665 and briefly rose to nearly €0,10 in April. In May, the price mostly moved around €0,07, after which it dropped sharply in June to €0,0342635. The price ended the quarter at €0,0357735, 46.2% lower than at the start. In April, ESMA made it clear that crypto providers without a MiCA license had to prepare for an orderly shutdown or customer migration, making licensing and access to services concrete focus points for the European crypto market.
  • Q3 2026 - Price range: €0,031837 - €0,0611425
    Mira started the quarter around €0,0358 and rose quickly in early July. In July, the price briefly reached €0,0611425, after which it fell back to €0,031837 in August. Mira then gradually recovered and ended the quarter at €0,046065, 28.8% higher than at the start. In July, the final transition period under MiCA ended; providers without the required license had to stop or wind down their crypto activities.
  • Q4 2026 - Price range: €0,040468 - €0,051657
    Through October 9, Mira first rose to €0,051657 and then fell to €0,040468. After that, the price recovered to €0,0440095. On October 5, the U.S. CFTC proposed a supervisory framework for crypto exchanges offering leveraged trading. This was a proposal for future oversight, not an implemented rule.

Mira resources


Trade Mira at Finst.
A platform with ultra-low fees.

As featured in De Telegraaf FD.nl CoinDesk Business insider Nederland MT/Sprout De Tijd

  • What is the current Mira price?

    Mira is currently priced at €0,040807, with a 24-hour trading volume of €3.039.615,82. This is a decrease of -5,71% in the last 24 hours.
  • How much Mira is in circulation?

    There are 358.247.124,81 MIRA in circulation.
  • What is the monthly price performance of Mira ?

    Mira has decreased by -5,35% in the last month. In the last seven days, Mira 's price has increased by +9,03%.
  • What is the yearly performance of Mira ?

    As of 25 October, price has changed by -84,45% compared to 12 months ago. Since the start of this year, the Mira price has decreased by -66,76%.
  • What is the all-time price performance of Mira ?

    The Mira price has seen an decrease of -83,95% since the launch of the project.
  • What is the all-time high of Mira ?

    The highest price that Mira has ever reached is €0,3126.
  • What is the all-time low of Mira ?

    The lowest price that Mira has ever reached is €0,031837.
  • How much Mira do you have for 1.000 euros?

    Based on the current Mira price, you would get 24.505,599529 MIRA for €1,000.

    Here’s an overview of different amounts:

    • €50 → 1.225,279976 MIRA
    • €100 → 2.450,559953 MIRA
    • €250 → 6.126,399882 MIRA
    • €500 → 12.252,799765 MIRA 
    • €1,000 → 24.505,599529 MIRA


Do more with your crypto


Winners of the day

  • Cap CAP
    € 0,0902721 +26,69%
  • € 0,0049735 +20,19%
  • Renzo REZ
    € 0,0042889 +13,54%
  • Osmosis OSMO
    € 0,04416 +7,27%
View on the Finst platform

Losers of the day

View on the Finst platform

Highest crypto staking rewards

View on the Finst platform

The crypto platform for all investors

Whether you're an active trader or long-term investor, Finst enables you to grow your crypto wealth with confidence and peace of mind.


Sign up