What Is an OHLC Chart and How Do You Read It in Crypto?
What Is an OHLC Chart?
An OHLC chart is a price chart that shows four prices per period: Open, High, Low, and Close. In other words, the opening price, highest price, lowest price, and closing price.
This kind of chart is also called a bar chart. Each thin bar is a short summary of what the price did during one chosen period. The vertical line runs from the lowest to the highest price. The short line on the left shows where the period started, and the line on the right shows where it ended.
In crypto, it always refers to a very specific market. An OHLC bar for BTC/USDT on a certain crypto exchange can therefore be different from a bar for BTC/USD on another platform. The chosen interval also matters: a 5-minute bar tells you something very different from a daily bar. For daily bars, the set time zone is also important, because it determines when a new day starts.
Key Takeaways
- OHLC stands for Open, High, Low, and Close: four prices within one period.
- An OHLC chart is also called a bar chart and consists of separate bars.
- The vertical line shows the highest and lowest price of the period.
- The left line is the opening price and the right line is the closing price.
- Always look at the trading pair, the platform, the interval, and for daily bars, the time zone too.
How Does an OHLC Chart Work?
An OHLC chart breaks price history into fixed chunks of time, or sometimes into a fixed number of trades. For example, if you choose a one-hour interval, you get one new bar every hour.
For a closed period, it works very simply:
- Open: the first recorded price in that period.
- High: the highest recorded price.
- Low: the lowest recorded price.
- Close: the last recorded price.
Say you are looking at BTC/EUR on one crypto exchange with one-hour bars. The first price at 10:00 is the Open. The highest and lowest prices between 10:00 and 10:59 become the High and Low. The last price before the next hour starts is the Close.
Example: You are looking at BTC/EUR. An hour starts at €60,000. During that hour, the price first rises to €60,500, then drops to €59,800, and ends at €60,200. The bar then contains Open €60,000, High €60,500, Low €59,800, and Close €60,200.
Just keep in mind that a bar that is still forming works differently. The Open is already fixed, but the High and Low can still change. At that point, the Close is simply the most recent price. Only when the period is over are all four values final.
Most charts are time-based, such as 1 minute, 1 hour, 1 day, or 1 week. There are also charts where a new bar only appears after a certain number of trades. In both cases, one bar always summarizes one defined chunk of trading.
How Do You Read the Parts of an OHLC Chart?
You read an OHLC bar from top to bottom and from left to right. The top is the High, the bottom is the Low, the line on the left is the Open, and the line on the right is the Close.
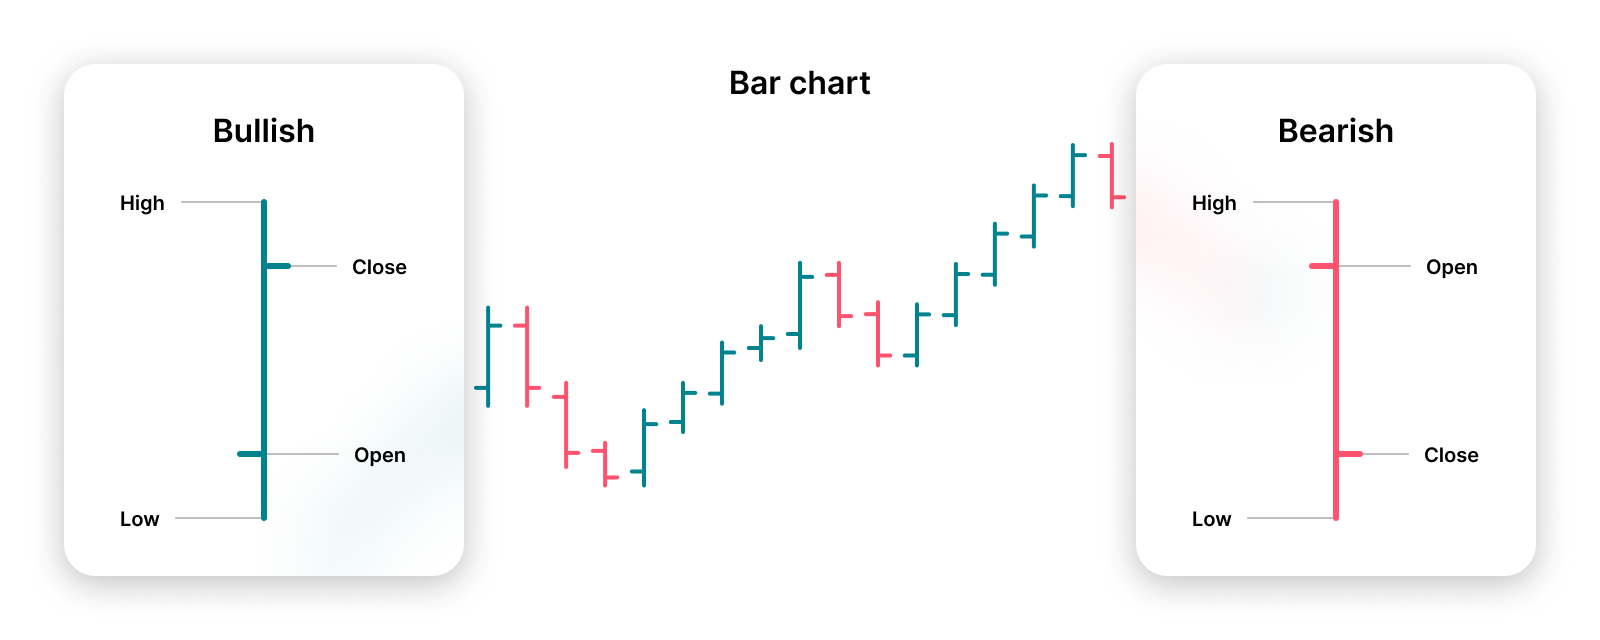
The distance between the top and bottom shows how large the price range was. If you compare Open with Close, you can see whether the price ended the period higher or lower than it started.
Color can be useful, but it is not a fixed part of an OHLC bar. A platform may color bars based on Close versus Open, but also based on Close versus the previous Close. So don’t rely only on green or red. Focus mainly on the two lines.
What Does the Opening Price Mean?
The opening price, or Open, is the first recorded price at the start of the chosen period. On an OHLC bar, you see it as the short horizontal line on the left side.
In crypto, Open does not automatically mean a market opens again after being closed overnight. Crypto trades 24/7. So the Open is simply the first price of the time period you are looking at.
For example, if you are looking at an hourly bar that starts at 2:00 p.m., the first price of that hour is the Open. That value stays the same, even if the bar has not closed yet.
What Do the Highest and Lowest Price Mean?
The highest price, High, is the highest recorded price within the period. The lowest price, Low, is the lowest recorded price in that same period. Together, they form the vertical line of the bar.
The difference between High and Low is called the price range, or the range. A large range means the price moved across a relatively wide area during that period.
That does not tell you why it happened or which direction the price will go next. A wide range records what happened, but it is not a prediction.
On a real-time bar, High and Low can still move. If a new higher price comes in, the High rises. If the price drops further, the Low falls.
What Does the Closing Price Mean?
The closing price, or Close, is the last price of a closed period. In an OHLC bar, this is the short line on the right side.
If the Close is above the Open, the period ended at a higher price than it started with. If the Close is below it, the period ended lower. That is the net price change within that one bar.
For a bar that is still forming, the Close is not final yet. At that point, it is simply the most recent available price, and it can keep changing until the period ends.
A regular line chart often uses only these closing prices. That makes such a chart calmer, but you no longer see how high or low the price moved in between.
What Information Does an OHLC Chart Give About the Crypto Market?
An OHLC chart shows, for each chosen trading pair, platform, and period, where the price started, where it ended, and how far it moved up and down in between. If you place many bars next to each other, you get a picture of historical price movements.
That lets you see, for example, whether price ranges are getting bigger or smaller, whether closing prices often end up higher or lower, and how a price moves over time. Technical analysts also use these charts as a base for adding indicators and their own lines to the chart.
Sometimes you will see OHLCV data. The V stands for volume: the amount traded during a period. Volume can add extra context, but it is not part of the four OHLC values themselves.
Important to know: an OHLC chart does not tell the whole story of the crypto market. It does not automatically show order book depth, bid-ask spread, liquidity, transaction fees, slippage, news, or on-chain data. Available liquidity can also differ from one crypto exchange to another. So a chart mainly describes prices on the chosen market, not the global price of crypto automatically.
What Is the Difference Between an OHLC Chart and a Candlestick Chart?
An OHLC chart and a candlestick chart normally use the same four price values. The difference is mainly in how you see that information.
In an OHLC bar, the vertical line runs from High to Low. The line on the left is Open and the line on the right is Close. In a candlestick, thin lines, also called wicks, show the High and Low. The thicker candle body fills the area between Open and Close.
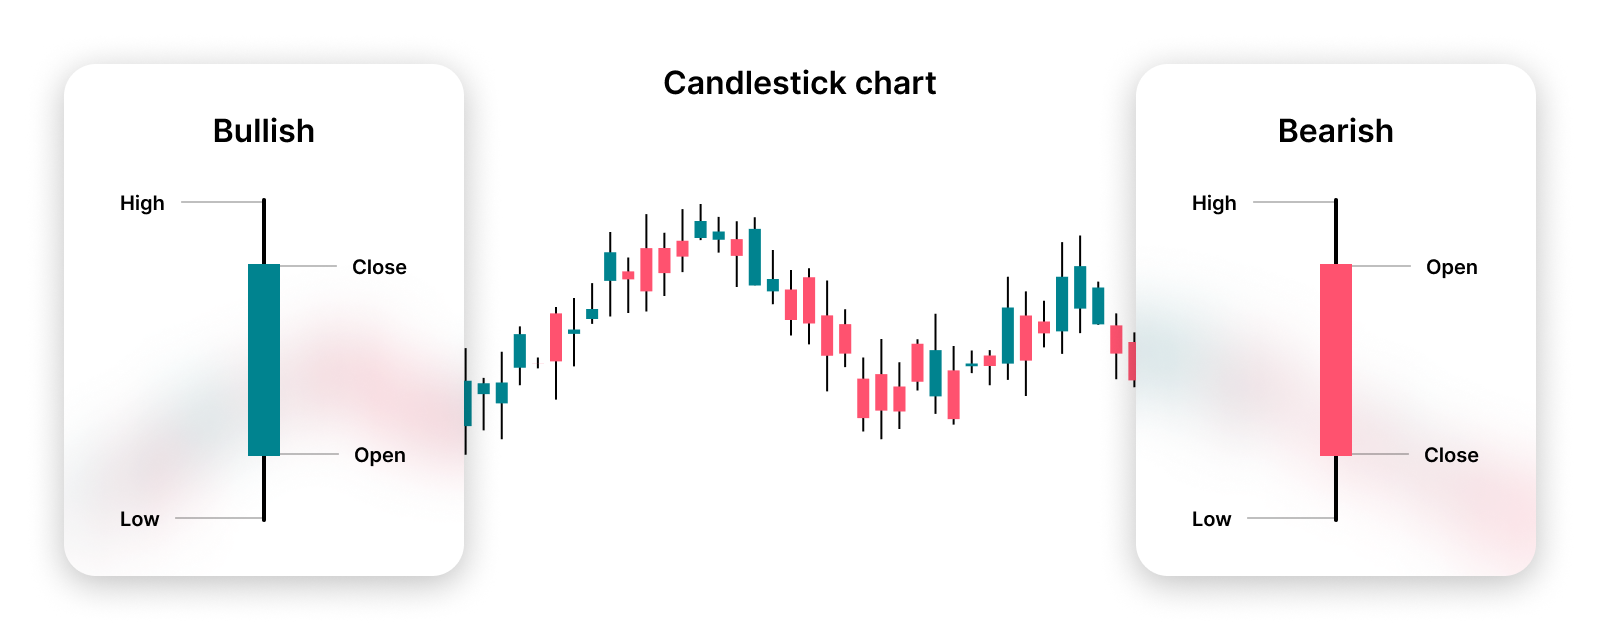
In short: the data are the same, the presentation is different. Many people find candles faster to read because the difference between Open and Close is shown as a clear block. OHLC bars are often more compact, which leaves more room for indicators and drawings on your chart.
This also applies here: colors and styling can be set up differently on each platform. So always look at exactly what a chart is showing.
What Are the Benefits and Limitations of an OHLC Chart?
An OHLC chart gives a lot of information in a small space. With one bar, you immediately see four important prices and the full price range of a period. That works on short intervals, like minutes, but just as well on days or weeks.
The main benefits are:
- You can see Open, High, Low, and Close at a glance.
- Bars are compact and leave room for indicators and annotations.
- You can use the same chart style for different intervals.
- You can quickly compare price ranges and differences between Open and Close.
There are also clear limitations. An OHLC bar does not show the exact order in which the High and Low were reached. Maybe the High came first and then the Low, or the other way around. You also do not see every individual trade between the start and end of the bar.
That matters especially for analysis and backtests. A backtest tests a trading idea with historical data. If you only have OHLC data, you have to make assumptions about what happened inside a bar. Without good assumptions about fees, spread, slippage, and the unknown price order, a result can look better than it would in real life.
So OHLC data is descriptive, not predictive. A pattern on a chart or a strong historical backtest is no guarantee of future results.
Conclusion
An OHLC chart is a compact way to see what a price did within one period. Open, High, Low, and Close together give you a lot more context than just a single closing price.
Especially when you are just starting to read charts, it helps to first look at the four parts of one bar. After that, always check which trading pair, which crypto exchange, which interval, and which time zone you are looking at. That way, you know exactly which price movement the chart does show, and which information you cannot get from it.